

By Jen Robson, Digital Content Manager, Sharesight
Across 91,440 self-directed portfolios in FY26, the bottom 5% lost 18.1% or more and the top 5% gained at least 48.6%. Here’s what drove the gap and how to check your own portfolio against the index.
In her FY26 market wrap, ASA CEO Rachel Waterhouse noted “the index is not the same as an individual portfolio”. The S&P/ASX 200 finished the year up 2.77% on price and 5.9% with dividends reinvested, but almost nobody owns exactly the index. And new data shows how far real portfolios strayed from it.
To compare like with like, we’ve used the iShares Core S&P/ASX 200 ETF (IOZ) as our benchmark. It tracks the index closely, and returned 5.77% with dividends reinvested – 0.13 percentage points behind the index. Unlike the index figure, it also lets us add franking credits, which Sharesight counts as part of your return. With franking credits, IOZ returned 6.72% in FY26. That’s the benchmark we’ll use throughout this article.
An analysis of Sharesight data found that 69.7% of 73,819 investors beat the 6.72% benchmark. According to the State of the Australian Investor 2026 report, published by Morningstar with the same Sharesight portfolio data, the median portfolio returned 11.0% in FY26 and 82.4% of portfolios finished the year up. But the spread was wide: the bottom 5% lost 18.1% or more, while the top 5% gained 48.6% or more.
If everyone was “in the market”, why such different results? Mostly it comes down to three things: what you hold, where your return comes from and what you do.
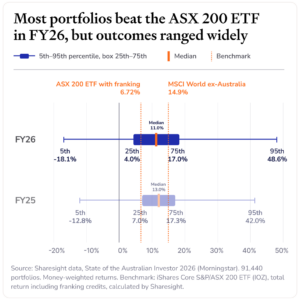
Graph 1 alt-text: Range of FY26 returns across 91,440 portfolios, from -18.1% at the 5th percentile to 48.6% at the 95th, with a median of 11.0%, compared with 6.72% for the iShares Core S&P/ASX 200 ETF (IOZ).
What you hold
ETFs are becoming the core
ETFs made up 26.2% of portfolio value at 30 June 2026, up from 22.6% a year earlier, and 64.2% of portfolios held at least one. The four most widely held investments were all ETFs: VAS, VGS, IVV and NDQ. Newer portfolios, those in the data for the first time in FY26, held 40% of their value in ETFs. Nearly half of investors (48.1%) now hold both ETFs and direct shares.
Direct shares stay close to home
The typical portfolio holding direct shares keeps 89.3% of that money in ASX-listed companies. Finance is still the largest sector at 25.8% of direct-share value, down from 28.0%, while non-energy minerals rose from 15.6% to 19.1%. Those shifts reflect price moves as much as decisions.
International exposure is bigger than it looks
Three of the four most-held investments are ASX-listed ETFs that track overseas markets. Because they’re listed here, they count as “Australian” on a holdings list. In FY26, 79.0% of the listed investment value in these portfolios sat in ASX-listed investments, but 28.1 points of that was ETFs, and at least half of that ETF money tracks international indices.
That matters because the world beat Australia in FY26. The MSCI World ex-Australia index returned 14.9% in Australian dollars, against 6.72% for the benchmark, even with franking credits included. A portfolio with a large slice of global ETFs was always going to look different to the local index – in FY26, for the better.
Where your returns come from
Income
Dividends, distributions and franking credits supplied 4.1 percentage points of the 11.7% dollar-weighted mean return of the analysed portfolios in FY26 (total gains divided by total invested capital) – about 35%. That’s up from 3.6 points in FY25. For the IOZ benchmark, dividends and franking credits supplied 4.24 points of the 6.72% total return – about 63%. Either way, a price-only comparison leaves a big part of your return out of the picture.
Franking credits
Part of the return on Australian shares comes as franking credits. They reduce the tax you pay and some investors get them back as a refund. In FY26, they added 0.95 points to the IOZ benchmark.
Currency
Exchange rates took 1.0 points off the FY26 return after adding 0.5 points in FY25. Capital growth supplied the other 8.6 points. When the Australian dollar rises, overseas assets are worth less in Australian dollars. International holdings bring currency risk in both directions.
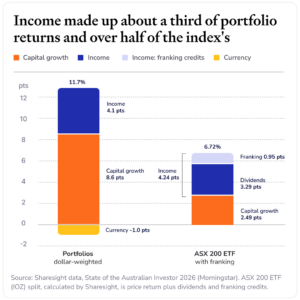
Graph 2 alt-text: FY26 portfolio return of 11.7% split into 8.6 points capital, 4.1 points income and minus 1.0 point currency, against the IOZ’s 6.72%: 2.49 points capital and 4.24 points dividends and franking credits.
What you do
Morningstar’s report found that the more investors traded, the lower their typical return. Investors who made no trades in FY26 had a median return of 11.99%, versus 9.64% for those who made more than 100. 83.1% of non-traders finished the year up, compared with 77.6% of the most active. Our data also shows recorded brokerage explains only about a third of that gap.
The finding is descriptive, not causal. Heavy traders differ in other ways, including portfolio size and the number of holdings, and the gap disappeared for portfolios over $500,000 in FY26.
How to review your own portfolio against the index
- Use total return. Include dividends, distributions and currency, not just price. Compare it against the ASX 200’s accumulation (total return) index. If your return includes franking credits, compare it against the index with franking credits included.
- Know which return you’re reading. Your portfolio return is usually money-weighted, reflecting when you added or withdrew money. Index returns are time-weighted. A large deposit just before a fall can drag your return below the index, even if you held exactly what it holds.
- Split your return into capital, income and currency. This will tell you if dividends are carrying the portfolio and how much of your result came from the exchange rate rather than your investments.
- Compare your weights. Financials and materials make up about half of the ASX 200, so being heavier or lighter there explains much of the gap between your return and the index.
Portfolio trackers like Sharesight split your portfolio performance into capital gains, dividends and currency automatically, and compare it against a benchmark you choose.
Build a benchmark that matches your mix
If part of your portfolio is international – and if you hold ETFs, it likely is – the ASX 200 alone is the wrong benchmark. Check the composition and concentration of your portfolio against different indexes to find one that’s relevant to your holdings.
Don’t be afraid to blend indexes – using FY26 figures, a 70/30 blend of the ASX 200 and MSCI World ex-Australia returned 9.2% and a 50/50 blend returned 10.8%. The median portfolio’s 11.0% looks very different against those than against the ASX 200’s 6.72%.
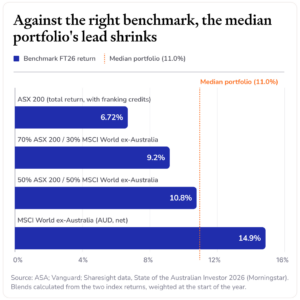
Graph 3 alt-text: FY26 returns for four benchmarks, from 6.72% for the IOZ benchmark (with dividends and franking credits) to 14.9% for global shares, against a median portfolio return of 11.0%.
Looking past the headline
The index is a reference point, not a scorecard. Most self-directed investors had a good FY26, but largely for reasons that had little to do with the ASX 200. Knowing what you own, why you own it and what it should be measured against is what turns a headline number into a useful one.